
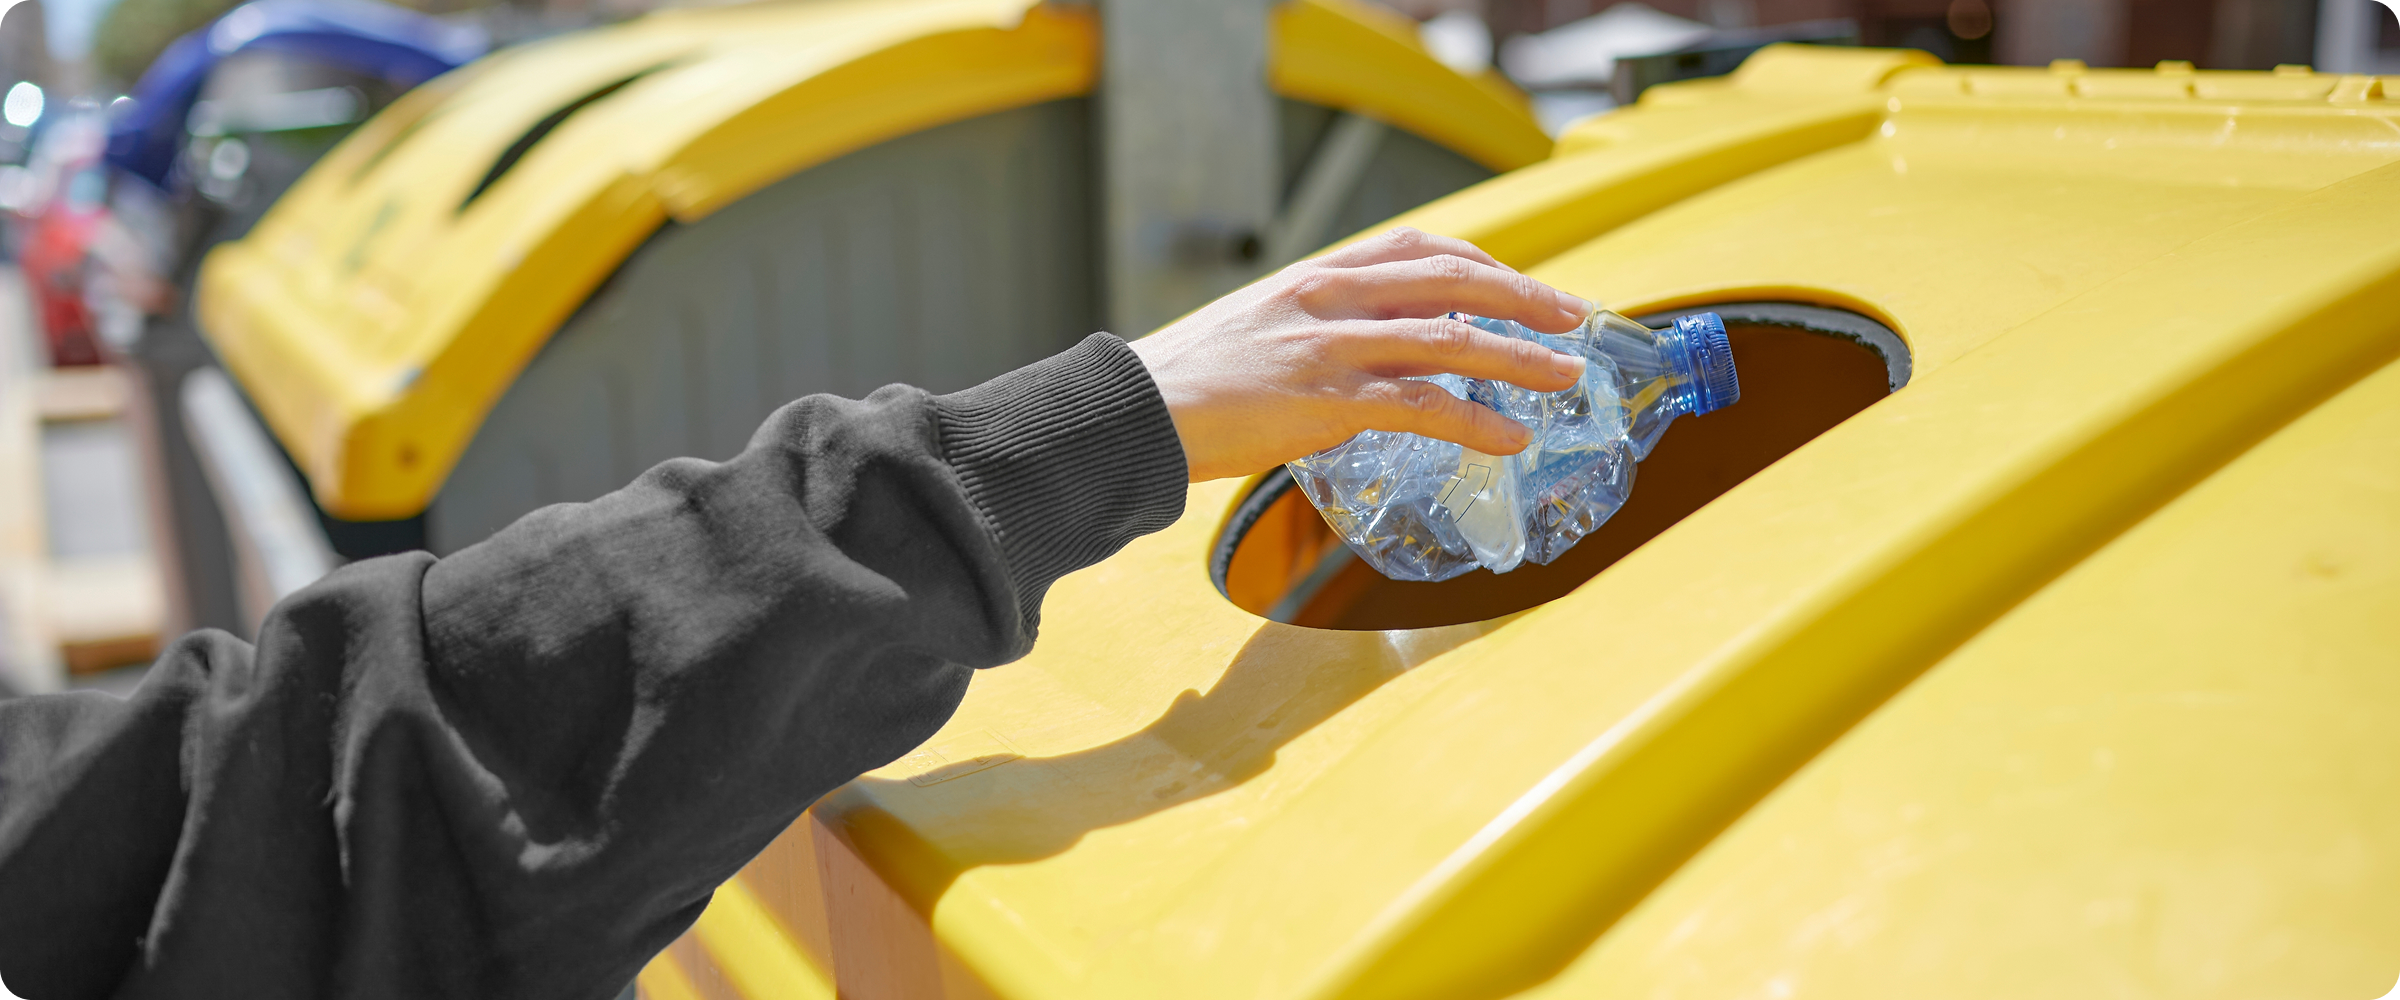
Lifecycle research looks at how much material a package requires, the emissions associated with producing and moving it, and what can happen when that material is recovered and used again.
Those comparisons show why sustainability is difficult to judge by material alone.
-
01 Raw Materials

-
02 Energy & production

-
03 Transportation

-
04 Use
-
05 Recovery

-
06 Recycling ↶ Back to 01

01 / 05 · PLASTIC VS. GLASS
10 of 12
10 of 12 Single-Use Comparisons Favored Plastic Over Glass
A systematic review of 53 recent lifecycle studies found 12 that directly compared single-use plastic with single-use glass packaging. Ten reported lower environmental impacts for plastic, while the other two found the materials comparable.
When the studies looked at reusable glass, results depended heavily on how many times the container was reused and how far it traveled. The larger finding is that replacing plastic with another material does not guarantee a lower environmental impact.
Read the systematic review of packaging lifecycle studies
03 / 05 · PACKAGING WEIGHT
92%
kg of packaging to deliver 1,000 gallons of soft drink
92% Less Packaging Weight Than Glass
The amount of packaging material required can vary dramatically depending on what’s being used. In the same beverage study, delivering 1,000 gallons of carbonated soft drink required about 194 kg of PET packaging, compared with 2,402 kg of glass packaging.
That is roughly 92% less packaging weight moving through the system. Lower weight can reduce the amount of material required to package a product while also affecting transportation and other lifecycle impacts.
See the full Franklin Associates report ↗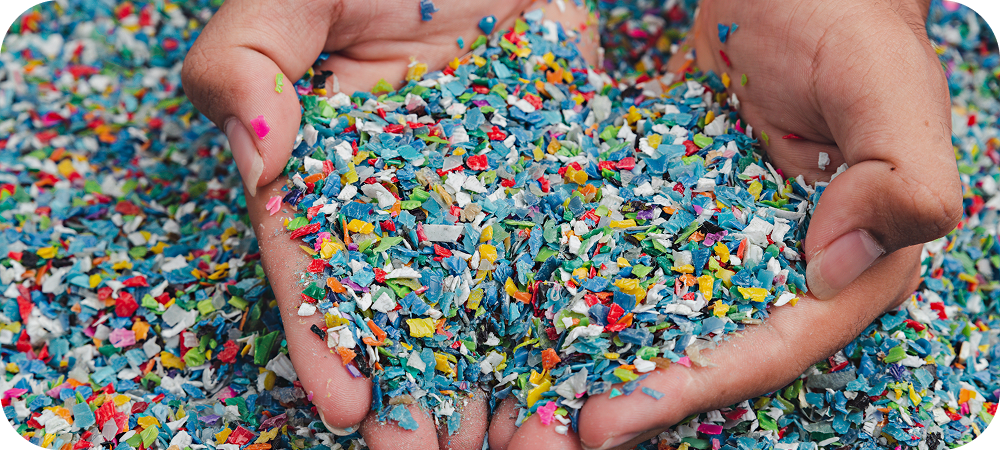
05 / 05 · RECYCLED PET
60%
Recycled PET production compared with virgin PET
60% Lower Greenhouse Gas Emissions for Recycled PET
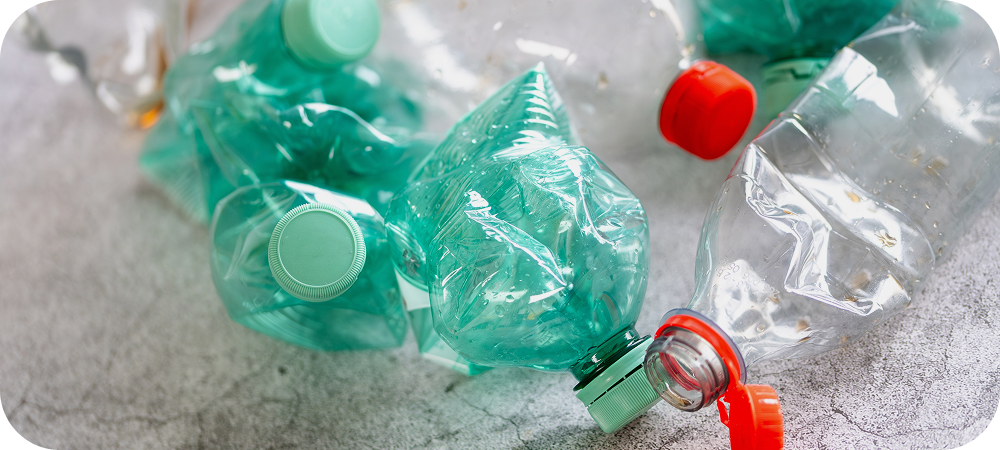
Recycling can positively change plastic’s environmental impact. A 2023 peer-reviewed lifecycle study found that producing useful PET material from used bottles could reduce greenhouse gas emissions by about 60% compared with virgin PET. It also reported an 85% reduction in fossil resource scarcity.
Bottle-to-bottle recycling keeps recovered PET in a high-value packaging application and reduces the need for virgin resin.