

Product Carbon Footprints, Explained
Published: October 12, 2026
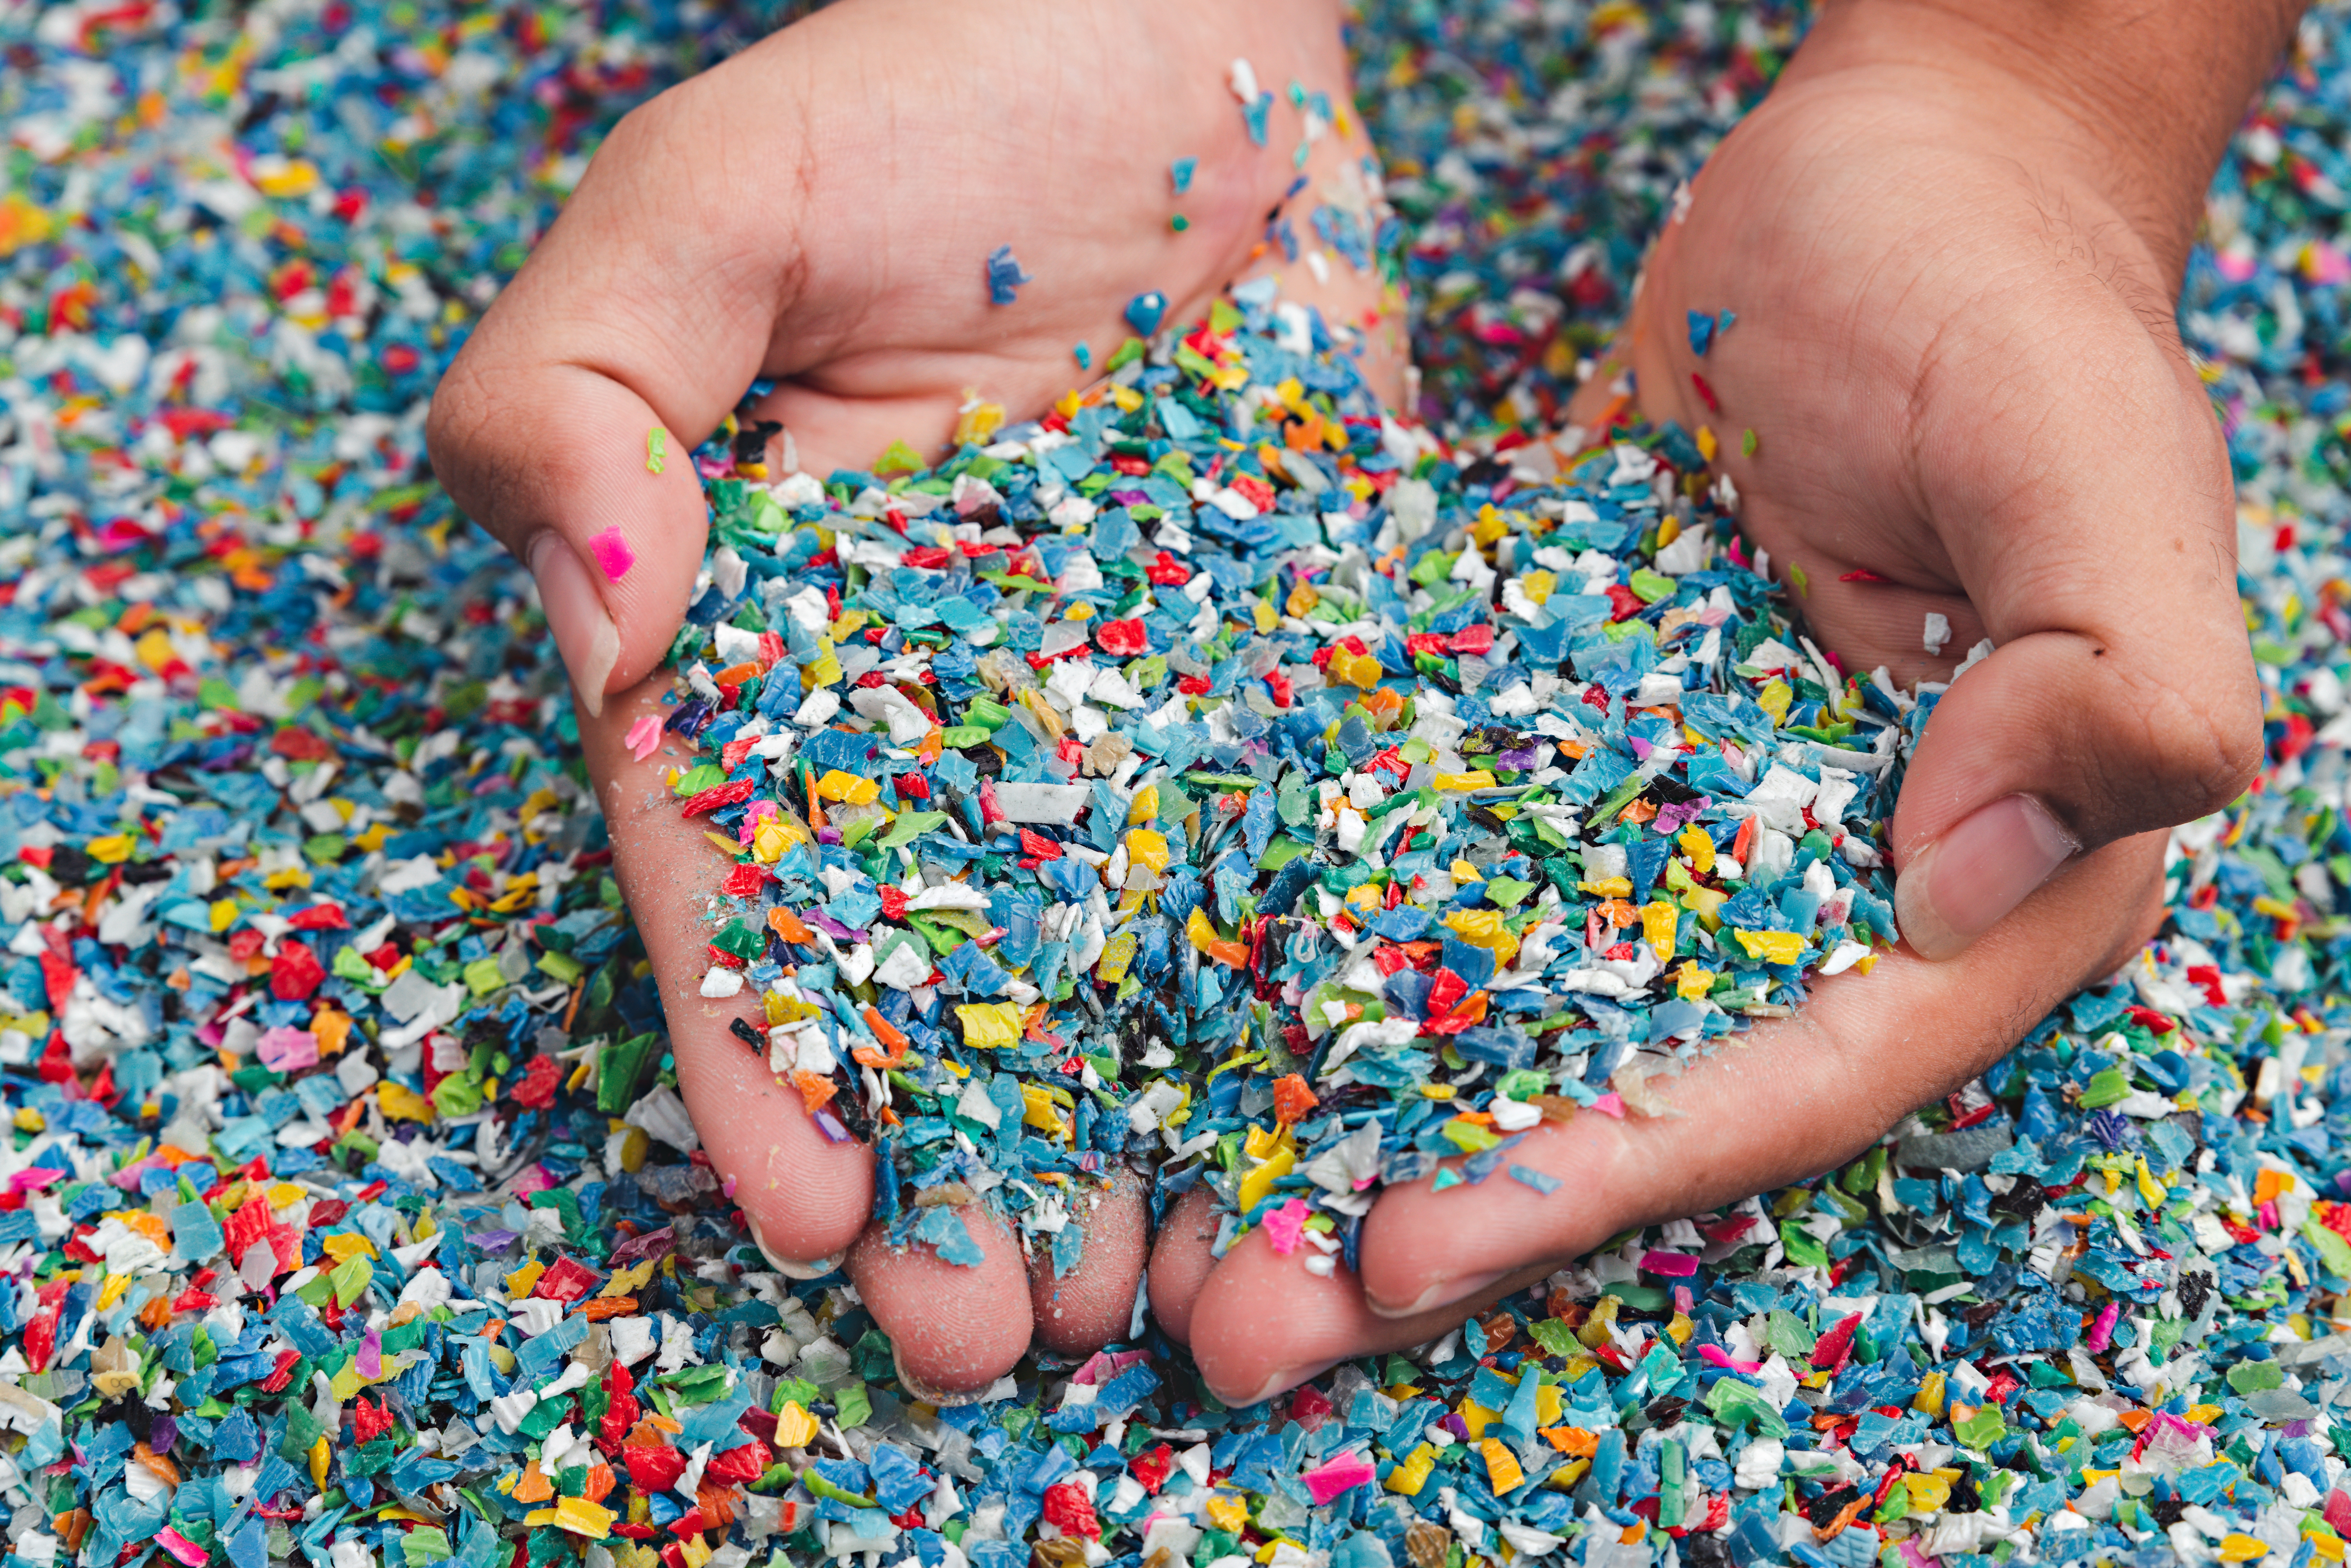
Pick up two white detergent bottles from a store shelf. They have the same shape, the same weight and the same cap. One is made from virgin high-density polyethylene (HDPE), and the other is made from recycled HDPE (rHDPE). To a shopper, they’re interchangeable. On a carbon ledger though, one of them may have roughly a seventh of the emissions of the other.
The only way to measure that difference is with a Product Carbon Footprint (PCF). PCFs are quickly becoming how brands, suppliers and regulators talk about the climate impact of what they make and buy.
What a PCF Measures
A PCF quantifies the greenhouse gas emissions tied to a single product, expressed in carbon dioxide equivalent (CO₂e). The international standard that governs it, ISO 14067, is built on the same principles as lifecycle assessment (LCA) under ISO 14040 and 14044. The difference is focus. An LCA can track water use, land use, acidification, and a range of other impacts. A PCF addresses climate change specifically.
Focusing solely on emissions is what makes a PCF so useful. Expressing a product’s climate impact as a single CO₂e value makes the information easier to share across the supply chain, incorporate into a customer’s emissions inventory, and compare with other products calculated using the same methodology. In that sense, a PCF isolates the carbon impact from the broader lifecycle picture and turns it into a metric buyers can use in decision-making.
What’s Inside the Number
Every credible PCF starts with a defined unit. For a plastic resin, the defined unit may be a kilogram or pound of material, depending on the market and methodology.
Next comes the system boundary, which decides what counts. A cradle-to-gate footprint covers everything from raw material extraction to the moment the product leaves the factory. A cradle-to-grave footprint continues through distribution, use and end of life. ISO 14067 treats a study that covers only some stages as a “partial” carbon footprint. It’s an important distinction, because a cradle-to-gate figure shouldn’t be presented as a product’s full climate story.
Inside that boundary, practitioners combine primary data measured at the actual site with secondary data from established databases. Each emission source is converted to CO₂e using global warming potential (GWP) values. These put methane and nitrous oxide on the same scale as carbon dioxide. When one process makes more than one output, allocation rules decide how its emissions are divided.
ISO 14067 excludes carbon offsets, so a PCF reflects what a product actually emits, with no credits netted against it.
The Rulebook Is Converging
ISO 14067:2018 is the core international standard. The GHG Protocol Product Life Cycle Standard offers a parallel framework that many companies also follow. It comes from the World Resources Institute (WRI) and the World Business Council for Sustainable Development (WBCSD).
Those two paths are coming together. In April 2026, ISO and the GHG Protocol finalized a joint working group to develop a harmonized product-level accounting standard. They pointed to growing demand from companies, investors and regulators for detailed emissions data across value chains. When the two largest standard-setters agree to write one rulebook, product footprints are clearly moving from best practice toward baseline expectation.
How a Footprint Travels
A packaging supplier’s PCF usually doesn’t stay with the supplier. It becomes part of the brand owner’s Scope 3 inventory. Scope 3 covers the emissions a company doesn’t produce directly but takes on through the materials and services it buys.
For years, many brands filled that category with industry averages. The WBCSD’s Partnership for Carbon Transparency (PACT) set out to change that. It created a methodology and data-exchange standard that let suppliers share cradle-to-gate PCFs in a consistent format. The goal is supplier-specific numbers in place of generic estimates.
Regulation is adding urgency in the U.S. California’s Climate Corporate Data Accountability Act (SB 253) requires Scope 3 reporting beginning in 2027 for large companies doing business in the state. For brand owners covered by the law, suppliers who can provide well-documented PCFs make that reporting far more accurate.
Where Plastic Packaging Fits
In a cradle-to-gate footprint for a bottle or container, the polymer itself is a major line item. That makes material choice one of the most impactful actions a brand can take. Using recycled content makes those efforts even more effective.
ALPLA’s latest site-specific calculations demonstrate just how much recycled content can make a difference. Working with long-standing partner c7-consult, the company recently recalculated PCFs for recycled materials in Brazil and Austria. At the ALPLArecycling plant in São José dos Pinhais, Brazil, a site-specific emission factor for rHDPE was determined for the first time. It came in at 0.34 pounds of CO₂e per pound of material, about 86% lower than virgin HDPE.
The Austrian results from Wöllersdorf tell a similar story. rHDPE there measured 0.44 pounds of CO₂e per pound of material, around 81% below virgin material. Recycled polyethylene terephthalate (rPET) pellets came in at 0.27 pounds of CO₂e per pound of material, about 91% below virgin PET.
From Disclosure to Design Decision
With site-specific PCFs in hand, a brand can compare recycled material from one plant against another, and both against virgin resin. It can do that while designs and sourcing plans are still open. The same “recycled” claim can have different carbon values depending on process and location. Precise figures show teams which choice lowers their footprint the most.
That helps brands set realistic recycled-content targets and weigh where their material should come from. It also gives them a baseline to track as suppliers recalculate. ALPLA, for example, benchmarks its recycled figures against virgin material data from the Ecoinvent database, and regular updates keep that comparison current as plants and energy sources change.
Reading a PCF Honestly
A PCF is only as comparable as the method behind it. Two footprints calculated with different boundaries or data sources can’t be fairly lined up side by side. The GHG Protocol notes that product-specific rules are what make fair comparisons possible.
A PCF also has a deliberately small perspective. It says nothing about whether a package can be recycled or where it ends up after use. That’s why it works best alongside design-for-recycling criteria and other circularity measures. Used together, they give a fuller picture of a package’s impact than any single number.
As a single global product standard takes shape and Scope 3 reporting becomes routine, the carbon number attached to every bottle will travel further and carry more weight. By measuring it carefully and using it to choose better materials, companies can continue to move forward on circularity in a tangible way.